Dashboard tour
The Dashboard (the portal home page, the first item in the MCP Gateway menu) is your workspace at a glance: connector health, AI-client activity, this cycle's usage, and your MCP endpoint, all on one…
Written By Christopher Scaminaci
Last updated 4 days ago
The Dashboard (the portal home page, the first item in the MCP Gateway menu) is your workspace at a glance: connector health, AI-client activity, this cycle's usage, and your MCP endpoint, all on one screen. This page walks through each section top to bottom.
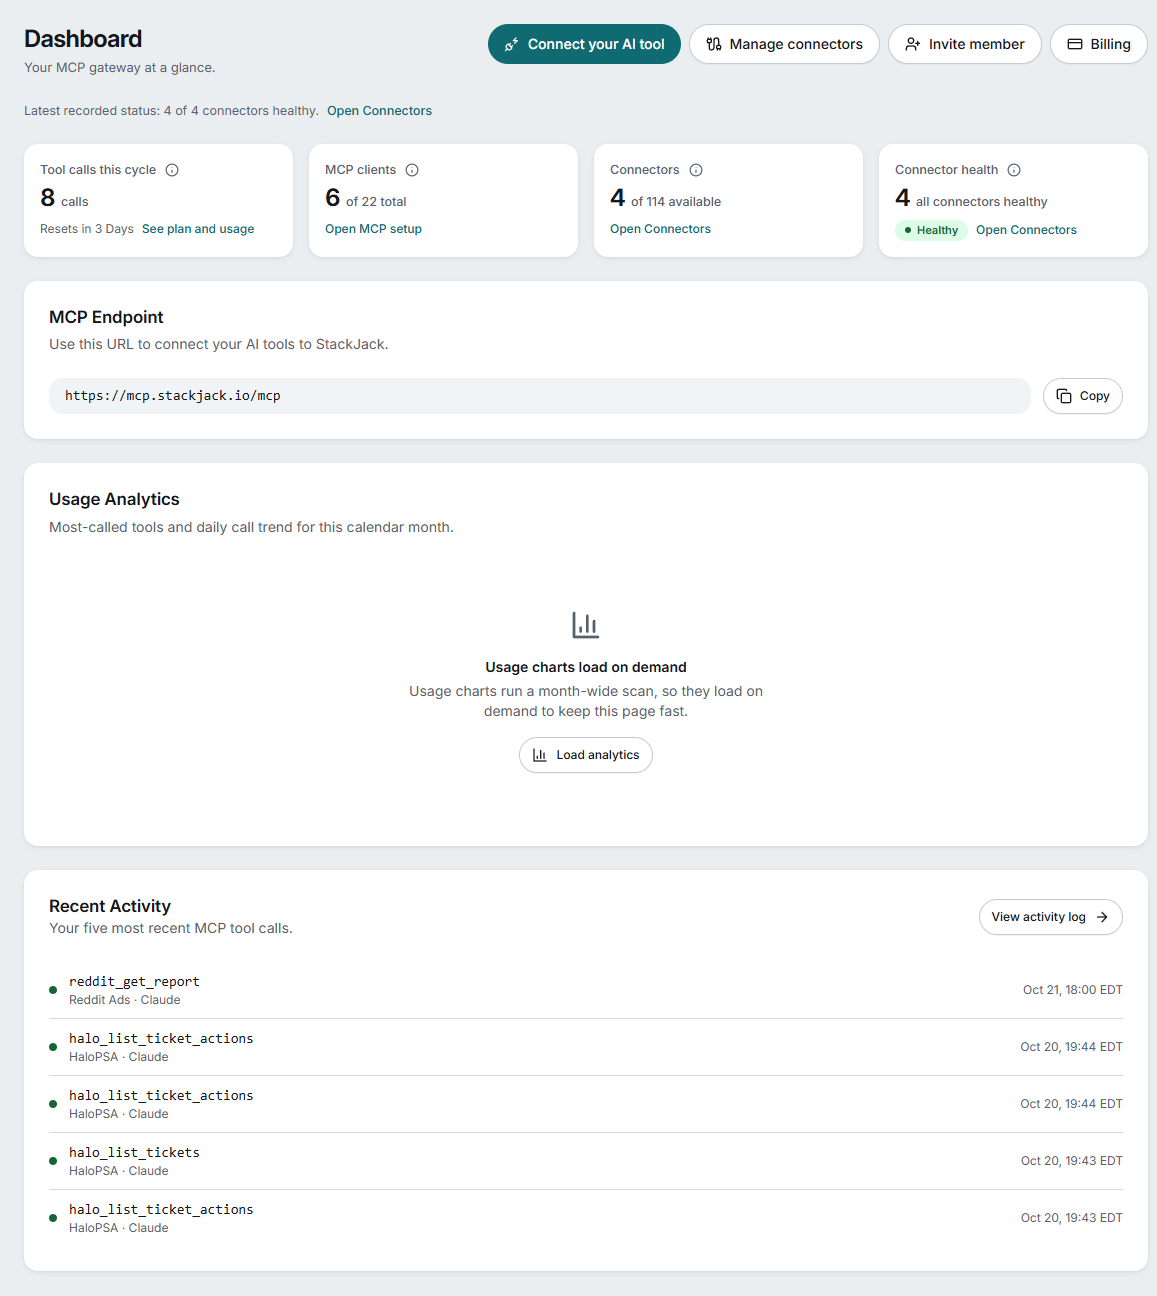
The page header and its buttons
The title Dashboard and its one-line description are drawn by the portal's shell, as on every page. The four buttons beside the title are the things most people come here to do:
- Connect your AI tool opens MCP setup.
- Manage connectors opens the Connectors page.
- Invite member opens Team.
- Billing opens Billing and usage.
The guided welcome tour
On your first visit (unless the setup wizard opens instead), an interactive welcome tour walks you through the main navigation, the summary tiles, the MCP endpoint, and where key pages live. Most portal pages also have their own mini-tour:
- Replay the current page's tour any time with the compass button in the header (its accessible label is Take a tour of this page).
- A tour counts as seen as soon as it starts, so it does not start by itself again after the portal is updated or after you leave it half way.
- Show the tours again in the Help menu (bottom of the left rail) asks you to confirm, then clears all tour history in this browser, so every tour (and the setup wizard, if setup is incomplete) plays again.
The attention bar
If a connector's credentials stop working, a bar above everything else on the page names it and offers a Fix now button (a member who cannot manage connectors but has a personal sign-in of their own sees Fix your personal sign-in instead, which opens that sign-in). The bar cannot be dismissed, because a dead connection outranks every figure below it, and it is simply absent when every connector is fine.
Under it sits one quiet line with the latest recorded status, for example "Latest recorded status: 3 of 3 connectors healthy.", with an Open Connectors link. With no connectors it says "No connectors are connected yet." This is the most recent stored check, not a live probe.
The four tiles
Four tiles run across the page, each with a small information icon that explains the figure and a link to the page behind it:
Note the windows differ by design: the "Tool calls this cycle" tile counts each subscription's own billing cycle, while the Usage Analytics charts below count the calendar month. The two can legitimately differ.
Getting started (first-run only)
Until your workspace is fully set up, the Dashboard helps you finish. Account managers see a Finish setting up StackJack checklist card that tracks the core setup steps — connect an MSP tool, connect your AI assistant, and (optional) invite your team — with a "n of 2 steps complete" count. The card auto-hides the moment your core setup is done.
Alongside the checklist, a single highlighted next-step prompt appears in place of data you don't have yet:
- Managers with no connectors: a "Get Started" alert with a Configure Connectors button that opens the setup wizard at the add-a-tool step.
- Managers with connectors but no AI connection: a Set Up MCP Connection prompt that opens the wizard at the connect-your-AI step.
- Members of a workspace that isn't set up yet: an informational note to ask their account owner.
These surfaces disappear once setup is complete.
Where connector status and subscriptions went
The Dashboard no longer carries a per-connector grid or a card per subscription. They live where you manage them:
- Each connector's latest recorded status, with how long ago it was checked and the last validation error when it isn't healthy: Connected under Connectors in the menu (MCP Gateway → Connectors → Connected). Per-user connector health is under Connectors → My sign-ins.
- Plan prices, each subscription's usage for the cycle, the cycle-reset countdown and any payment-status warning (Past Due, Paused, Canceled): Billing and usage → Plan and billing.
Usage Analytics
These charts load on demand. The panel starts with a Load analytics button and a note explaining that usage charts run a month-wide scan and so load on request to keep the page fast. Select it and the panel fills in with the calendar month's total call count plus:
- Top Tools This Month — which tools your AI assistants call most.
- Daily API Calls — call volume per day.
- Daily API Calls by Team Member — a multi-series line chart showing where each member landed each day, with total usage drawn as its own line. It appears only when there is per-member data to plot, and it carries a caption saying whether the member lines are meant to add up to the total. Read that caption before comparing the two.
Each chart shows an empty-state message until there is traffic.
MCP Endpoint
A card with your workspace's MCP endpoint URL and a Copy button — the same URL you paste into any AI assistant. See the MCP setup page (MCP Gateway → MCP setup) for the standard and compact endpoint URLs and a link to step-by-step setup guides for each AI tool.
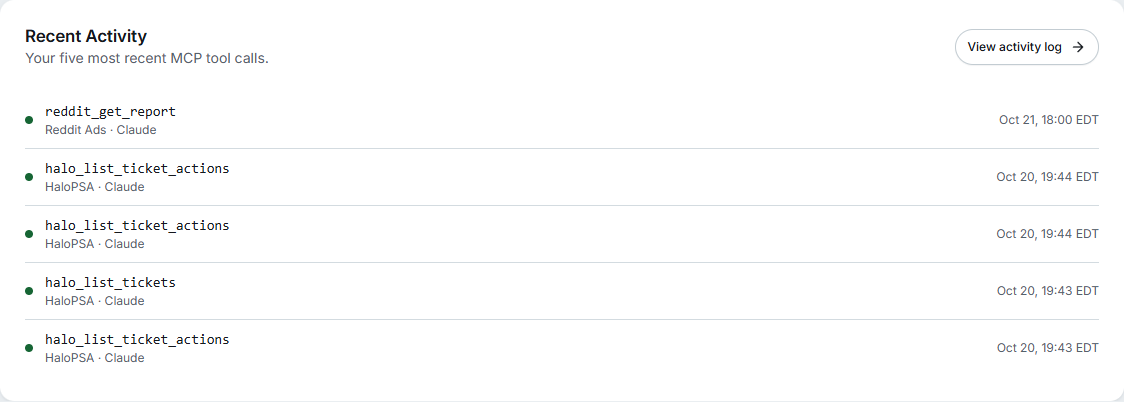
Recent Activity
A glance at your five most recent tool calls. Each row shows:
- The tool name that was called (for example a ticket-search tool).
- Its connector and the AI client (MCP client) that made the call.
- A green or red dot indicating success or error (screen readers hear "Succeeded" or "Failed").
- The time it ran. The Portal shows US Eastern time for everyone, whatever your own time zone, and labels each timestamp EST or EDT so the label matches the hour beside it through the daylight-saving change.
Before any call has been made the card shows "No activity yet" with a Connect your AI tool button.
For the full history — browsing further back with filtering, sorting, and CSV export — use the View activity log button at the top of the card, which opens the Activity log (Billing and usage → Activity log, /audit).
If the Dashboard doesn't load
- Loading skeletons are normal for a moment on entry.
- A restricted access panel (with a support code) in place of the page means your sign-in worked but your workspace access needs attention — see Your first sign-in.
- A "Temporary Load Failure" warning means the workspace data could not be fetched just now — reload the page; contact support if it persists.
Was this helpful?
Still need help? Ask the team