Audit Logs
The Audit Logs page (Audit Logs in the left sidebar, at /audit) is where you browse, filter, sort, and export connector tool-call metadata. It is the full-history companion to the Dashboard's Recent…
Written By Christopher Scaminaci
Last updated 3 days ago
The Audit Logs page (Audit Logs in the left sidebar, at /audit) is where you browse, filter, sort, and export connector tool-call metadata. It is the full-history companion to the Dashboard's Recent Activity glance — the same records, but browsable back through your plan's display window with filters and CSV export.
Each audit record contains structured metadata — the tool, connector, MCP client, attributed team member, timing, outcome, and, for a failure, an error detail of up to 2,000 characters. Neither the page nor the CSV export includes the call's request parameters or the data a successful call returned, so the trail shows what ran without exposing the contents of a ticket, asset, or device record. The failure detail is the exception to that: it carries text produced locally — a gate refusal, a timeout, a network fault, malformed input — or, when an upstream API rejected the call, StackJack's summary line followed by that API's error response, with recognized credential material redacted and the rest verbatim. See Where to See Your Usage for the other places these records appear.
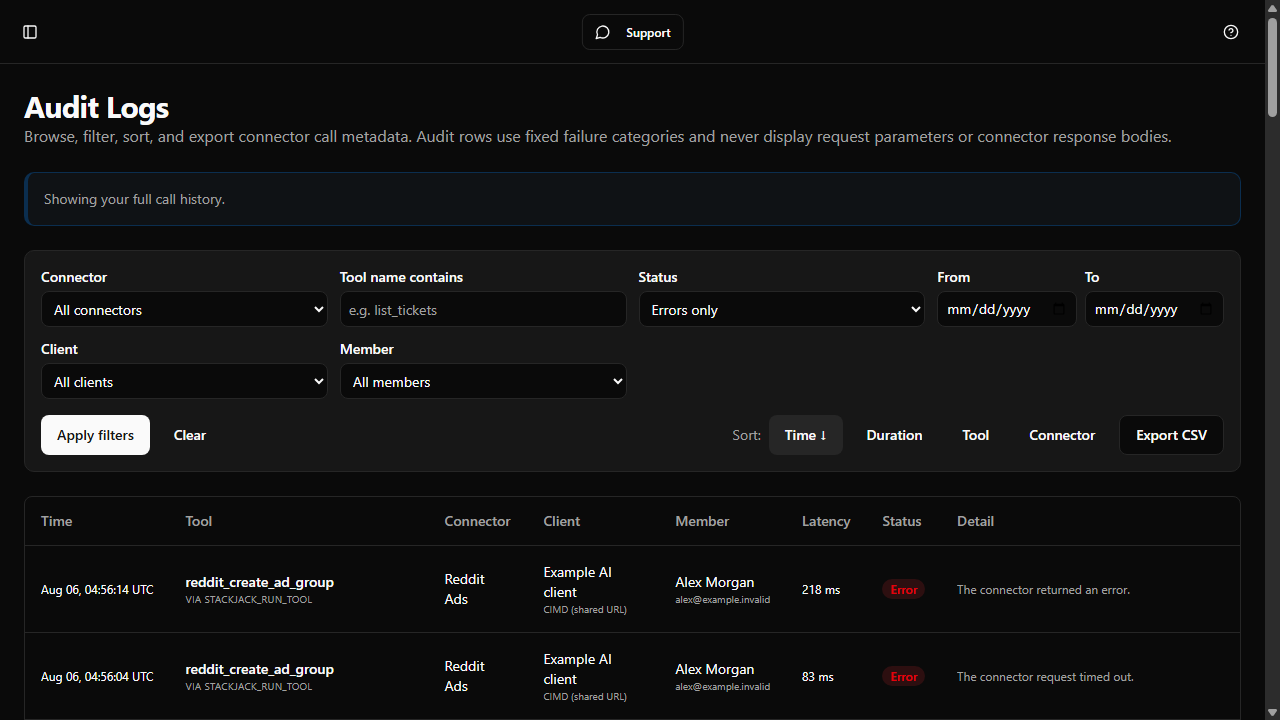
A populated, privacy-reviewed error view. The member and client labels are fictitious; the tool and connector metadata comes from real calls.
What you can see: the plan display window
The Audit Logs view shows a rolling window of recent activity, and how far back that window reaches depends on your plan:
Your effective plan for this window is the highest tier across all your active connector subscriptions — one Pro connector gives the whole organization the 90-day window, not just that connector's calls. A workspace with only Free subscriptions gets the last-100-calls view.
This is a display window, not a retention limit. Free showing "the last 100 calls" does not mean older calls were deleted. The window above controls only how far back this page lets you page through — not how long StackJack keeps the records. See Usage Data Retention for how long records are actually kept. If you need to reach further back than your plan's window shows, upgrade any connector or contact support for an export.
Who can browse, filter, and export
The full windowed browse — filters, sorting, and CSV export — is available to organization owners, co-owners, and Administrators (anyone who can manage MCP clients).
Plain members get a read-only view of their own most recent 100 calls — the tool calls made under their own identity. Calls with no member attribution (shared-credential or API-key client calls) are not shown to a plain member. They see a note to ask an admin if they need the complete audit trail, and don't see the filter, sort, or export controls. The CSV export endpoint re-checks this permission on the server from your sign-in — it is scoped to your own workspace and can't be pointed at another organization's data.
Reading the table
Each row is one connector tool call. The columns are:
No column carries the call's request parameters or the data a successful call returned. Detail is the one column where provider text can surface, and it comes from one of two places. When an upstream API rejected the call, the detail is StackJack's own summary line (which connector, which status) followed by that API's error response — those are the only two paths by which a provider response reaches an audit row, and both scrub it on the way in, replacing recognized credential material (tokens, API keys, passwords, Authorization headers, private keys) with a redaction marker before the row is stored. Every other failure stores text produced here rather than upstream — a gate refusal such as an exhausted allowance or a tool not enabled for the client, or a local error such as a timeout, a temporary connector block, a network fault, or malformed input — and carries no provider payload at all. Either way the stored row is bounded at 2,000 characters. Your AI assistant is handed a fixed error type instead (rate_limited, not_found, authorization_expired, and so on); the audit row keeps the fuller detail so support can work a problem without asking you to reproduce it.
Treat the Detail column as potentially sensitive. It describes a call that did not succeed, and that is not the same as containing nothing of yours. A vendor writes its own error messages, and one can name a record, quote a field, or repeat a value it was given — so a detail can carry a customer name, an email address, an asset identifier, or other content from your systems. The redaction marker targets credential patterns, not personal information. That applies to the CSV export as well. See What usage records contain.
Filtering and sorting (full view)
The filter bar (owners/co-owners/Administrators) lets you narrow the window by:
- Connector — a single connector, or all.
- Tool name contains — a substring match on the tool name (for example
list_tickets). - Status — all, success only, or errors only.
- Client — a single MCP client, or all.
- Member — a single team member, or all.
- From / To dates — an inclusive date range. The To date includes the whole day you pick.
The Client and Member dropdowns list the clients and members already present in the rows you've loaded, so their options grow as you select Load more. Select Apply filters to run them, or Clear to reset. Sort by Time (the default, newest first), Duration, or Tool — select a sort button again to flip between ascending and descending. Sorting and filtering run on the server across your whole plan window, so they cover far more than the rows currently loaded on screen.
The list loads a page at a time; select Load more at the bottom to pull the next page. There is no total-count spinner — paging is designed so it never slows live usage.
Exporting to CSV
With filters set the way you want them, select Export CSV. The download streams the current filtered, windowed result set as a CSV file (it opens in a new browser tab and saves automatically). The export honors the same plan window and the same connector / client / member / tool / status / date filters shown in the bar. Its columns mirror the on-screen view, and its Error column carries the same detail text the Detail column shows — including upstream provider error text on a failed call. Like the page, it never carries the call's request parameters or the data a successful call returned.
Related pages
- Where to See Your Usage — the Dashboard, Billing, and Team usage views, and calendar-month vs. billing-cycle counting.
- Usage Data Retention — how long records are actually kept, independent of the display window above.
- Monthly Call Allowances — the quota the successful calls in this log count against.
Still need help? Ask the team