Where to See Your Usage
StackJack attempts to record each connector tool call your AI assistants make, and the portal gives you several views of the recorded activity. A record can occasionally be missing, so do not use…
Written By Christopher Scaminaci
Last updated 3 days ago
StackJack attempts to record each connector tool call your AI assistants make, and the portal gives you several views of the recorded activity. A record can occasionally be missing, so do not use these views as the only evidence for a requirement that demands complete capture. See Usage Data Retention. This page tells you where each view lives, what it counts, and — importantly — which views count by calendar month and which count by billing cycle.
What gets recorded per call
A successfully recorded connector tool call (a single action your AI assistant performs, like "list open tickets") produces one usage record containing:
- The connector and tool name that was called
- Whether it succeeded or failed, and on a failure an error detail of up to 2,000 characters
- How long it took, in milliseconds
- Which MCP credential made the call, and — where the connection identifies a person — which team member
- When it happened
The record does not contain the call's arguments or the data a successful call returned — no request parameters, no ticket bodies, no asset or device records.
The failure detail is the one place provider text can appear. It is either text produced locally — a
gate refusal (an exhausted allowance, a tool that isn't enabled for the client), a timeout, a network
fault, malformed input — or, when an upstream API rejects the call, StackJack's own summary line
followed by that provider's error message. That second case is the only way a provider response
reaches the record, and it is scrubbed on the way in: recognized credential material — tokens, API
keys, passwords, Authorization headers, private keys — is replaced with a redaction marker before
the row is stored. The detail is kept deliberately, so support can diagnose a failure without asking
you to reproduce it.
Do not read that as "no customer data". The masking targets credential patterns, not personal information, and a vendor writes its own error text. A provider message can name a record, quote a field, or repeat a value it was given, so it can carry a person's name, an email address, an asset identifier, or other detail from your systems. Treat usage records and their exports as sensitive. The full disclosure is in What usage records contain.
Two rules worth knowing:
- Recorded failed calls never count against your monthly allowance. Only successful calls consume quota. Blocked attempts (wrong plan tier, tool not assigned, allowance exhausted) can also appear, so admins can see what was attempted.
- StackJack platform tools don't consume any connector allowance. Calls to the built-in
stackjack_*tools (session info, health check, service status, support tickets) are free — they aren't metered against any connector, and they don't produce usage records, so they won't appear in the Recent Activity glance or the usage charts either.
Calendar month vs. billing cycle
You'll see two kinds of usage numbers in the portal, and they intentionally differ:
The per-connector numbers match exactly what the enforcement gate uses — if a card says 4,980 / 5,000, your AI has 20 successful calls left on that connector before its cycle resets. The calendar-month numbers are a convenience view of overall activity.
The Dashboard (/)
The portal home page is your main usage view.
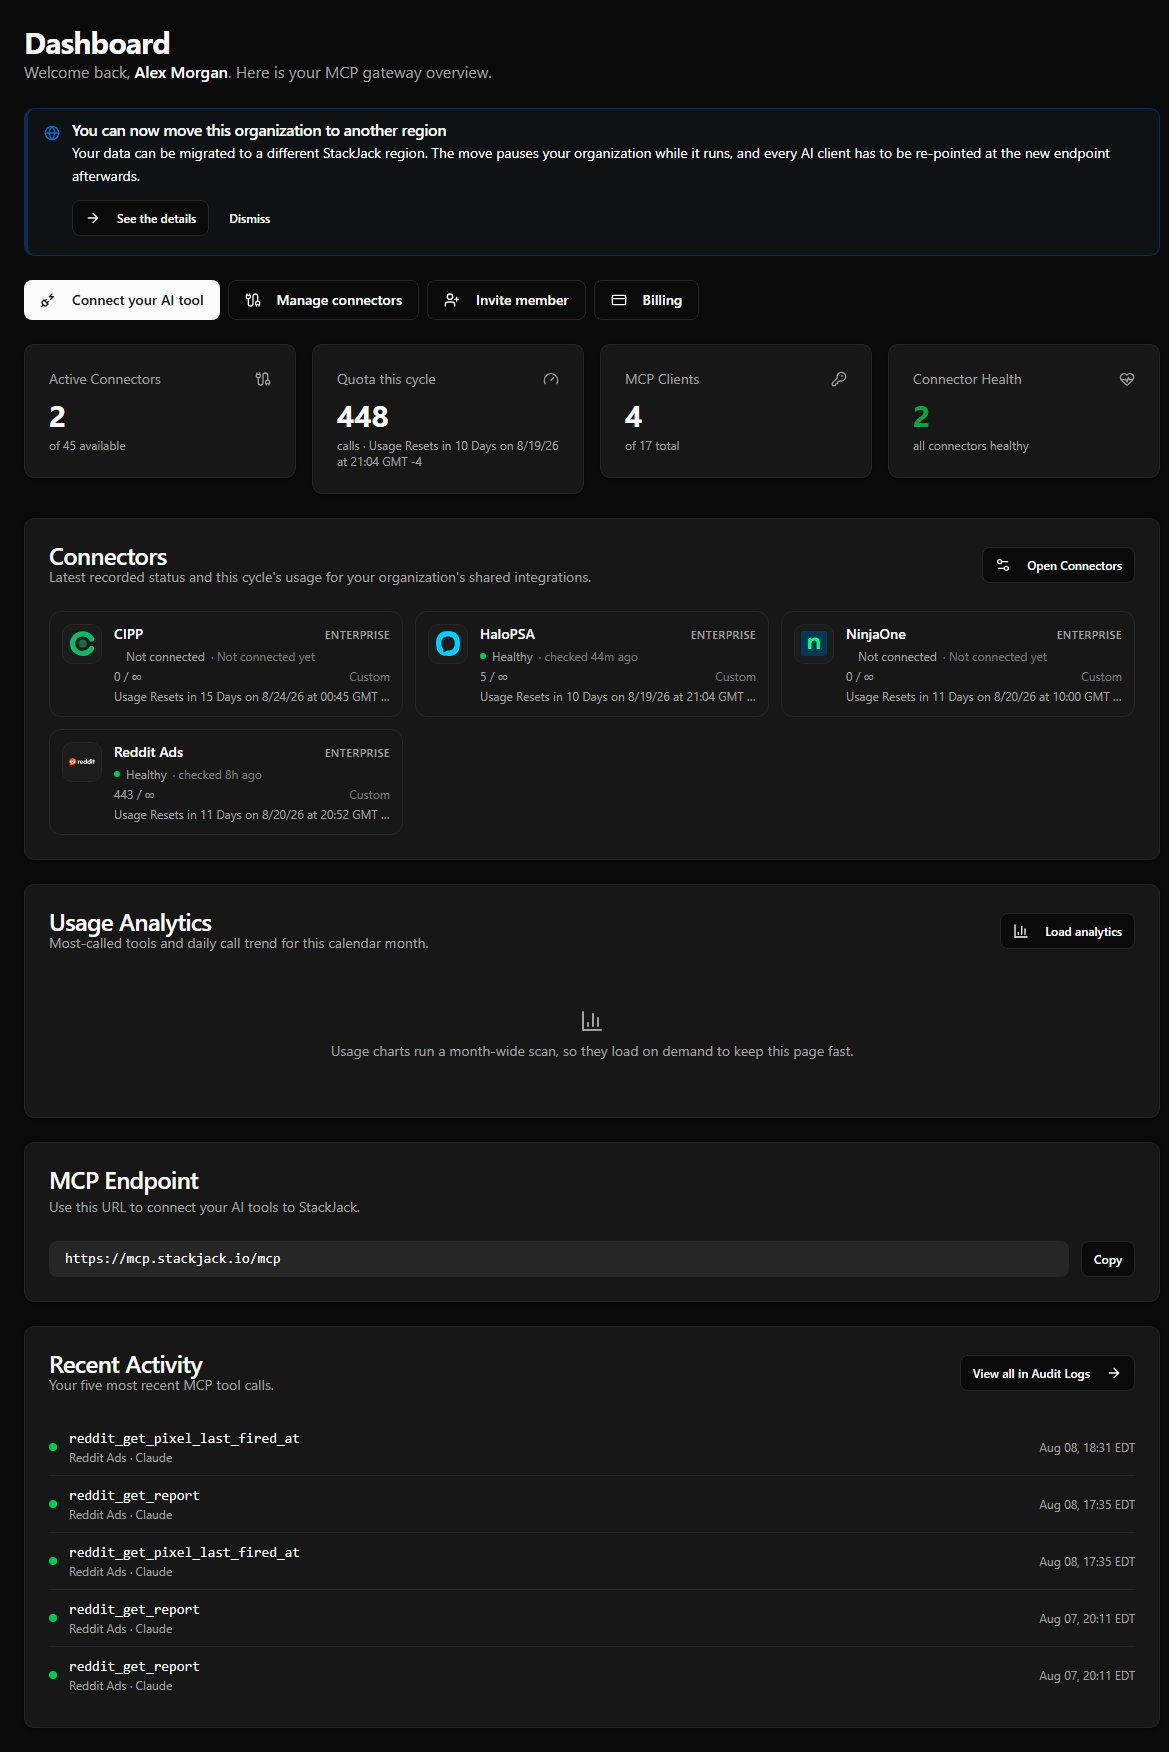
Summary cards — Active Connectors, Quota this cycle (combined usage against each subscription's billing-cycle limit), MCP Clients, and Connector Health.
Connector subscription cards — one card per active connector subscription, each with:
- A usage progress bar showing used / limit for the connector's current billing cycle. The bar is green below 80%, amber from 80–99%, and red at or above 100%. Unlimited subscriptions show an infinity symbol.
- A countdown to the cycle reset, which turns amber within 24 hours of reset and red if the cycle's reset is overdue.
- A payment-status badge if the subscription needs attention (Renewal Failed, Paused, or Canceled).
Usage Analytics — three charts covering the calendar month to date: Top Tools This Month, Daily API Calls, and Daily API Calls by Team Member. The section loads on demand, so open it before you expect the charts to appear.
Recent Activity — the five most recent tool calls, each showing the tool name, its connector and the MCP client that made the call, a green/red success indicator, and the time. Times on the Dashboard are shown in US Eastern wall-clock time, labeled EST in winter and EDT in summer. That is a fixed display zone for everyone, not your own local time, so convert if you work elsewhere. The Audit Logs page uses UTC instead, so the two pages can show different clock times for the same call. This is a compact glance; use the View all in Audit Logs button — or the Audit Logs page (/audit) — for the full, filterable, exportable history including the per-user, duration, and status detail.
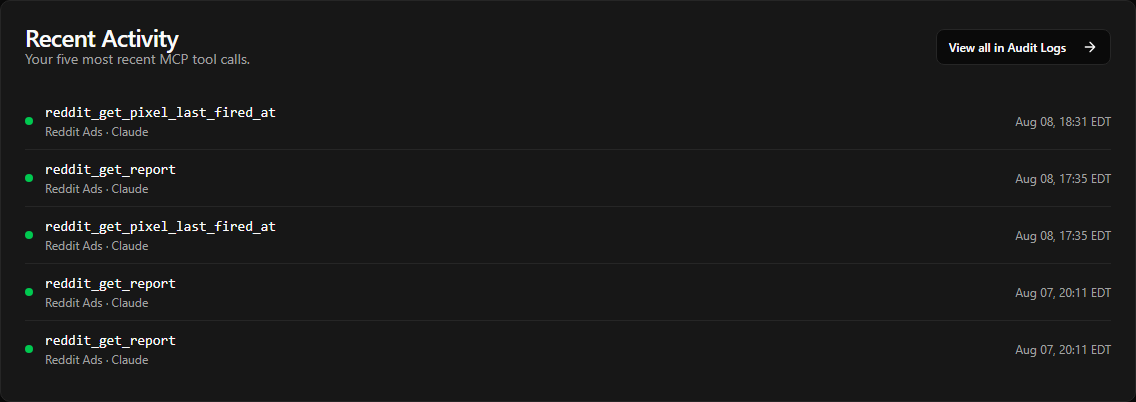
The Dashboard's Recent Activity is a glance at your latest calls. To browse further back with filters, server-side sorting, and CSV export, open the dedicated Audit Logs page (/audit).
The Billing page (/billing)
The Billing page leads with a Usage this month card: one row per connector, showing its logo, its successful calls against the cap its own billing cycle enforces, a colour-coded meter, and when that cycle resets. Rows are ordered busiest first, so whatever is closest to its limit is at the top. Connectors that made no calls this cycle are summarised on a single line rather than repeated as empty rows.
The card also shows your success rate and average latency for the calendar month, and — once a month has enough active days for the shape to mean anything — a calls-per-day chart. Below it a one-line summary always states how many days you have been active and which was busiest.
Two windows meet on this page and the card labels both: the per-connector meters count successful calls inside each connector's own billing cycle, while the month figures at the top of the page and the calls-per-day view count all calls, failures included, across the calendar month. The Active Subscriptions table below carries plan, price, status and each subscription's enforced monthly limit. See The Billing Page.
The Team page (/team)
The Team page shows a per-member call count so you can see who is actually driving AI usage. Note this count is all-time, not monthly.
For your AI assistant
Your AI can check its own usage position without you opening the portal — ask it to run stackjack_session_info, which returns each active connector's plan and monthly call limit. When an allowance runs out, the error your AI receives includes the exact usage, limit, and reset time (see Monthly Call Allowances).
If a connector appears enabled but calls still fail, follow Connectivity and health checks before treating the problem as an allowance issue.
Still need help? Ask the team